Live water data
Lake and river levels near Louisville
Current levels for every lake and river we cover, straight from federal gauges. Each reading shows its source and the time it was taken. We refresh at most every 30 minutes.
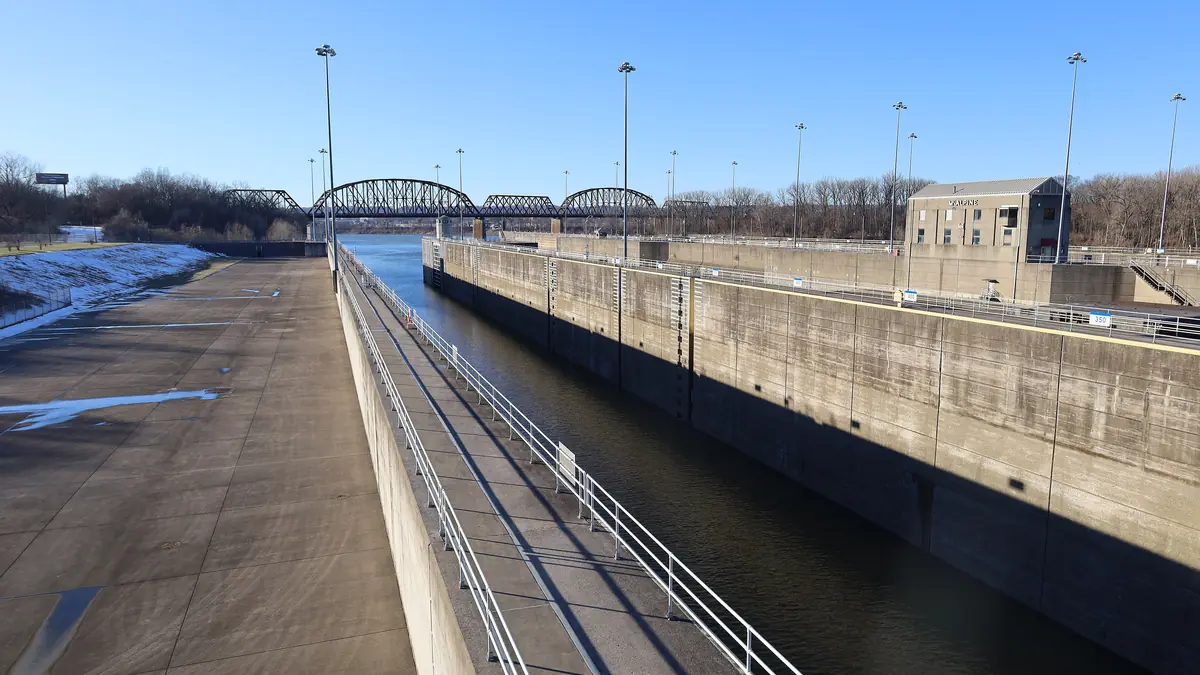
Ohio River Level at Louisville Today
9.95 ft below flood stage (23 ft at this gauge per the National Weather Service; action stage 21 ft)
- NWS forecast, McAlpine upper12.80 ft
- Stage below McAlpine Dam (USGS 03294500, Ohio River at Louisville)10.94 ft
- Flow at Louisville (USGS 03294500)27,900 cfs
- River elevation near Madison, IN (Clifty Creek gauge)421.97 ft
| NWS gauge | Observed | Forecast | Flood stage |
|---|---|---|---|
| McAlpine upper gauge (Louisville, above the dam) (MLUK2) | 13.05 ft Oct 28, 2026, 5:00 PM ET | 12.80 ft for Oct 28, 2026, 8:00 PM ET | 23 ft |
| McAlpine lower gauge (Louisville, below the dam) (MLPK2) | 10.94 ft Oct 28, 2026, 5:00 PM ET | 11.20 ft for Oct 29, 2026, 2:00 PM ET | 55 ft |
| Clifty Creek gauge (near Madison, IN) (CLFI3) | 421.97 ft Oct 28, 2026, 5:00 PM ET | 421.80 ft for Oct 29, 2026, 2:00 AM ET | 451 ft |
Provisional real-time data from federal agencies; it can change after review. Checked Oct 28, 2026, 5:44 PM ET.
Taylorsville Lake Level Today
1.07 ft below summer pool (547 ft) · 0.93 ft above winter pool (545 ft)
- Release from the dam (outflow)50 cfs
- Water temperature68.4 °F
Provisional real-time data from federal agencies; it can change after review. Checked Oct 28, 2026, 5:44 PM ET.
Rough River Lake Level Today
10.16 ft below summer pool (495 ft) · 14.84 ft above winter pool (470 ft)
- Release from the dam (outflow)860 cfs
- NWS forecast pool483.58 ft
Provisional real-time data from federal agencies; it can change after review. Checked Oct 28, 2026, 5:44 PM ET.
Nolin Lake Level Today
0.78 ft below summer pool (515 ft) · 24.22 ft above winter pool (490 ft)
- Release from the dam (outflow)128 cfs
- NWS forecast pool513.68 ft
Provisional real-time data from federal agencies; it can change after review. Checked Oct 28, 2026, 5:44 PM ET.
Where the data comes from
| Source | What we use | Waters |
|---|---|---|
| U.S. Army Corps of Engineers, CWMS Data API | Lake elevation (USGS-fed lake gauges and the Louisville District's hourly readings), dam outflow, Taylorsville water temperature | Nolin, Rough River, Taylorsville |
| NOAA National Weather Service (National Water Prediction Service) | Observed stage, flood stages and forecasts | Nolin (NOLK2), Rough River (RRLK2), Ohio River at McAlpine (MLUK2, MLPK2) and near Madison (CLFI3) |
| U.S. Geological Survey, Water Data API (new OGC API) | Stage and flow below McAlpine Dam (gauge 03294500) | Ohio River at Louisville |
Federal real-time data is provisional and can be revised. Elevations are in feet above sea level (NGVD29). River stages are measured from each gauge's own zero point and are not depths. If a source doesn't respond, we show the last good reading with its time, or a link to the official page.
Lake Cumberland, Barren River and Green River levels are planned next.